Congratulations to our PATHS-UP team on getting a top 10 cited paper, Sources of Inaccuracy in Photoplethysmography for Continuous Cardiovascular Monitoring of 2021 in Biosensors. This was a Thrust 3 paper, spear headed by two PhD students, and Dr Jessica Ramella- Roman and her team in FIU.

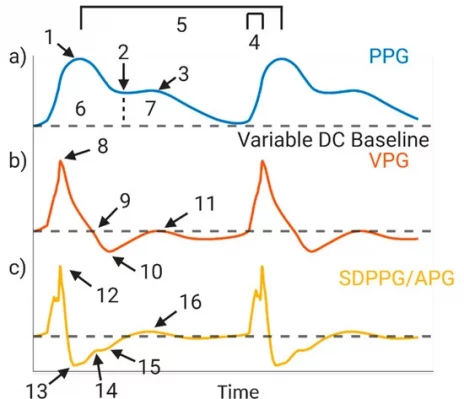
Figure 1
(a) Photoplethysmography (PPG) waveform: 1. systolic peak; 2. dicrotic notch; 3. diastolic peak; 4. slope transit time; 5. heart rate; 6. area under systolic waveform; 7. area under diastolic waveform; (b) first derivative, velocity plethysmograph (VPG): 8. max slope in systole; 9. end of systolic peak; 10. Start of dicrotic notch; 11. max slope in diastole; (c) second derivative, second derivative photoplethysmograph or acceleration plethysmograph (SDPPG/APG): 12. a-point; 13. b-point; 14. c-point; 15. d-point; 16. e-point.
